Not every metric can offer insights. But with the right combination of metrics, you can begin to steer your department and the business. Finding the correct mix begins with asking, “What do we track and why?”
Any business that’s mature enough to necessitate a DAM is mature enough to need data to guide its decisions. But many DAM dashboards are stuffed with inert metrics that don’t explain much. Typically, that includes numbers like total assets used, searches run, or approvals pending—what are known as process metrics.
Process metrics aren’t a bad thing to track, but they’re most useful in combination with what are known as outcome metrics. These are the numbers that indicate something either successful or unsuccessful happened—like the rate at which an ad converted, whether a creative campaign launched successfully, or whether users located what they were searching for.
Nothing works without good metadata

It’s nearly impossible to pull good outcome metrics without good DAM keywording and metadata. Because if you don’t know what keywords pertain to what, or what files contain what, your outcome metrics won’t tell a coherent story.
Without outcome metrics, how else will you know what your process metrics are saying? For instance, what if you make a substantial update to your DAM and it causes a spike in usage? On the surface, more logins, downloads, and time spent in the DAM may look great. But if that update of yours shifted buttons around and now people are clicking in frustration and downloading the wrong assets, more activity is not better—it’s actually a sign things are worse.
Only with an outcome metric like “successful searches completed” will you know if “more” equals good. It’s the difference between constructing a tall scaffold and constructing a tall scaffold that actually adheres to the building.
Process metrics
|
Outcome metrics
|
Always ask, “What decision am I going to make with this metric?”
Unhelpful metrics can distract you from the real user stories. With every metric, ask what decision you plan to make with it. You should begin with the question and work back to the metric that helps you answer it. And only track what you’ll use. Irrelevant metrics (sometimes called “vanite metrics”) will only distract you from the ones that matter.
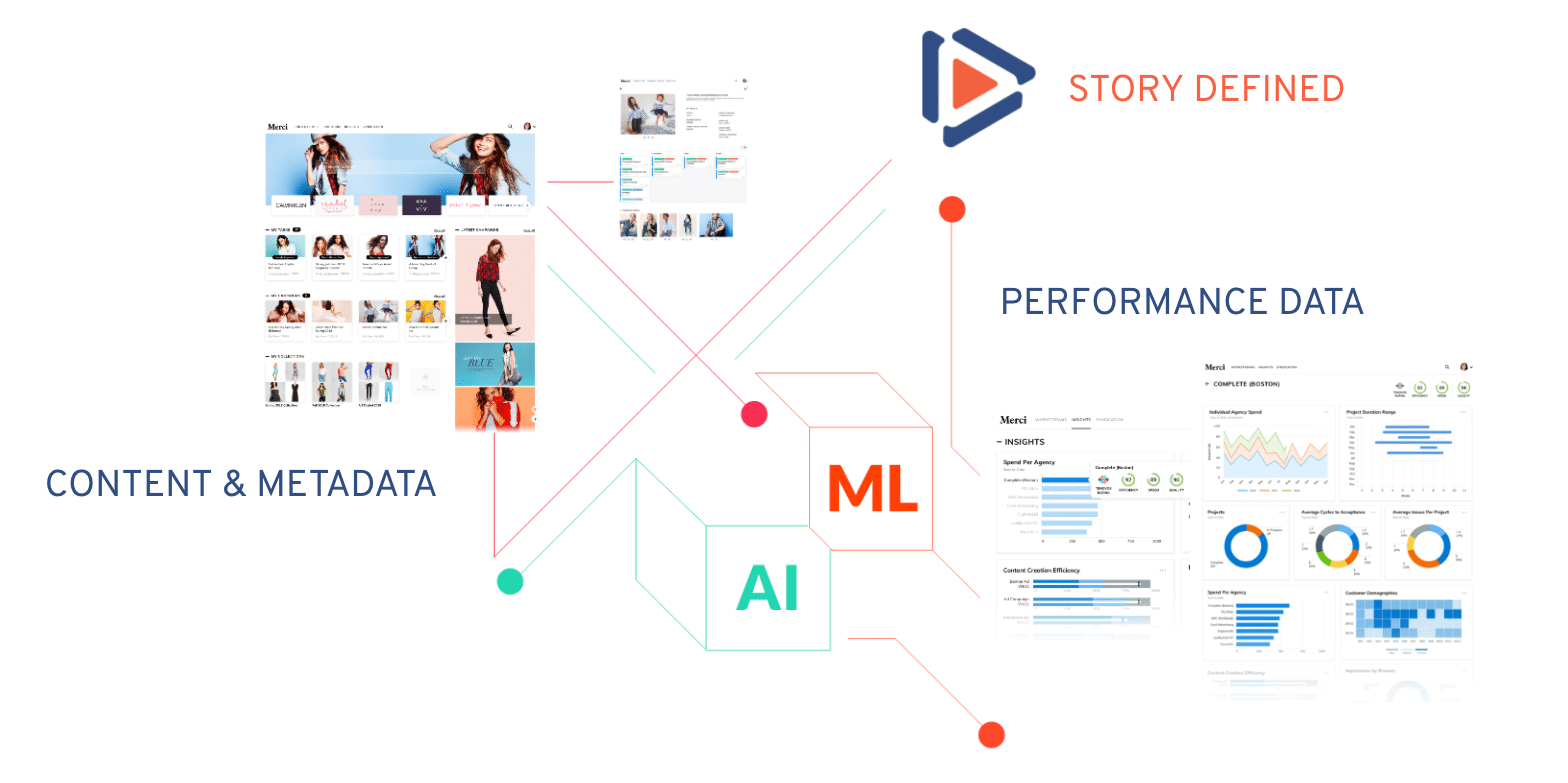
Process and outcome metrics differ in another important way: Process metrics are leading indicators whereas outcome metrics are lagging indicators. That is, one suggests what is going to happen, and the other tells you whether something went well. Put those together, and that’s a complete story. And if you know what you want your outcome metrics to look like, you can work back to figure out benchmarks for your process metrics, and detect trends.
It is only with a mixture of outcome and process metrics that you can begin to think about extracting insights from your dashboard. And it’s worth asking, what is an insight, anyway? For us, an insight is an anomaly in the data that suggests a useful relationship.
For example, let’s say you find that faster approvals lead to better ad performance. That itself is not the insight—you’ll have to dig deeper and ask why. Perhaps faster approvals tended to have fewer people involved. And when you ask the copywriters and brand designers, they tell you that when there are fewer reviewers, the work is more fun. That’s why it’s better.
If you know that, you’re no longer a purveyor of inert activity metrics. You have data that suggests that freeing creatives from long, tedious reviews might actually improve ad performance, as well as their enjoyment. If you can change that process, that’s a lot of productivity you can potentially unlock.
Insights like this do not come easy. You have to work hard at them. And oftentimes, you’ll find that DAM data analysis is a bit paradoxical. You may not know what you want to measure until you set things up, at which point, it’s difficult to change the DAM.
As just one example, let’s say a big beer distributor set up its DAM only for internal use, and only to measure internal metrics. The team knows how much beer was sold. But they have no contextual data around their distributor’s sales numbers, like website metrics or ad performance, and so they have no way of understanding the value of the individual assets they create. A constraint like that is tough to undo.
But if you manage to input sales data and squeeze some of the aforementioned insights from your DAM, you can help your organization understand the difference between greater activity and greater productivity. Lots of teams measure activity (number of assets hosted, time in DAM, etc.) without reference to the outcome. If you’re measuring outcomes, you can determine whether all that activity was actually productive for the business.
Pro tip: Ask everyone for their metrics wishlist
Whenever you have the opportunity, ask users and DAM-adjacent teams what metrics they look at, or metrics they wish they had—even if it seems unrealistic. You may find you have the ability to tell the same or similar story with your DAM data.


