
Sometimes making sense of your DAM’s data can feel like taming a tornado. Even if your creative team loves DAM data, and you know what metrics to pull, you’ll often find one important piece of the puzzle missing—things go dark once an asset leaves your system.
Those silos of data block you from accessing your metrics in one place, like in your DAM. Now, this may seem aspirational, but modern DAMs (like Tenovos) are innovating cyclical approaches to data. The question is, what do you do if your DAM isn’t there yet?
In this article, we’ll reveal how to think about DAM data within a virtuous cycle, so you can begin to connect all stages of an asset’s journey. We’ll also offer some examples of how this cycle can transform your siloed metrics into valuable insights—improving the creation process, the management of assets, and the measurement of performance.
The virtuous DAM data cycle
The traditional asset cycle isn’t really a cycle, is it? An asset is created, stored in the DAM, and then distributed. Three steps, often disconnected, which constitute three data silos in that asset’s journey.
In an ideal cycle, you’d tie those three stages together in a feedback loop. And view the data on the full cycle in one place. This would help you really understand the full story of your DAM and your assets. And give you the ability to use data from any stage to improve another.
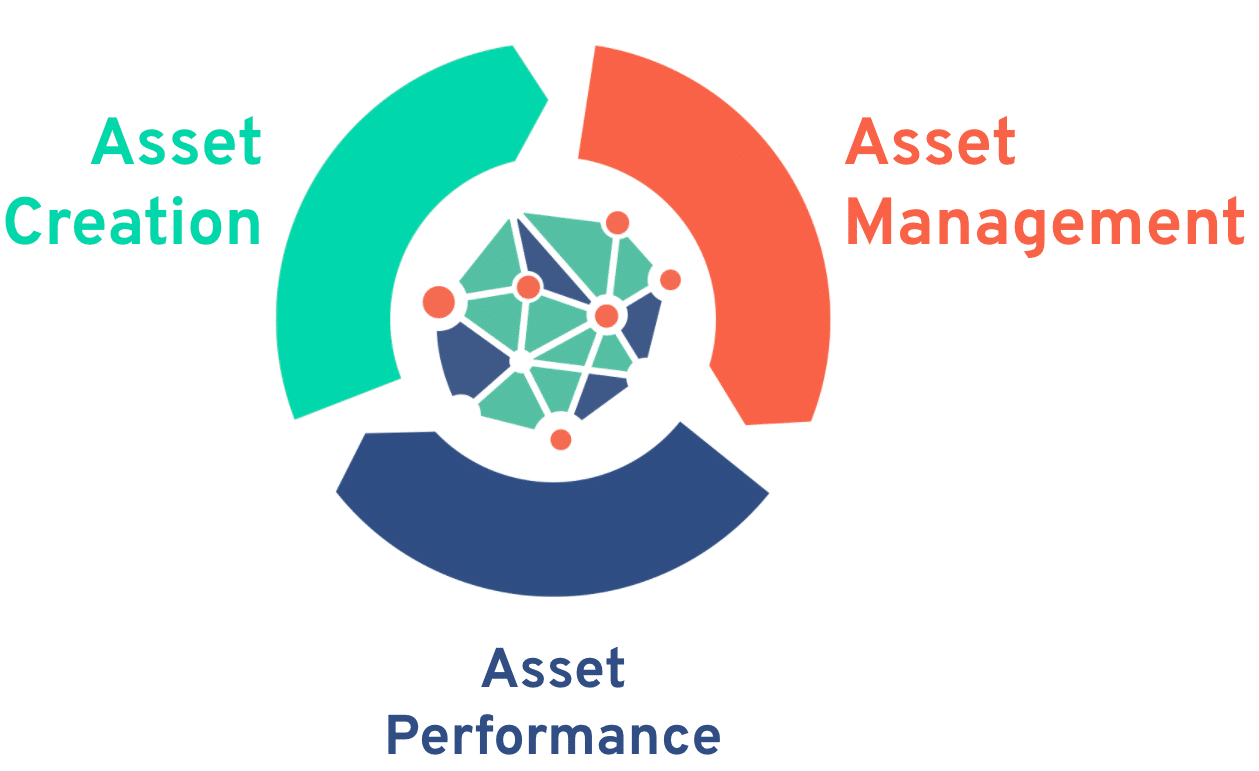
Here’s what that ideal cycle might look like:
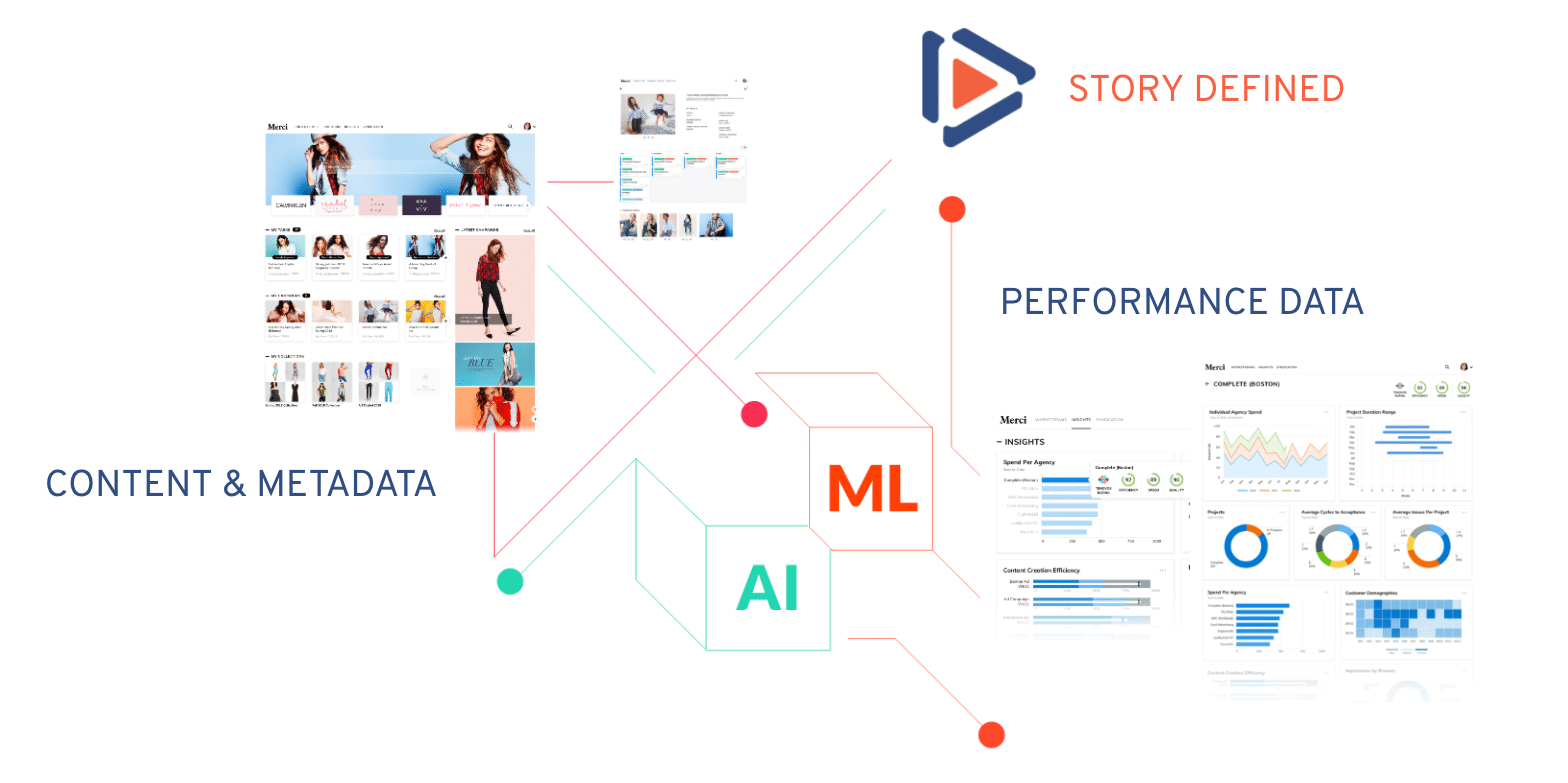
- Creation—partners, creative teams, and agencies working to ideate, approve, and review assets. In a good DAM, approval workflows can be completed and optimized from within the system. Data to capture here: activity (assets created), productivity (time per asset, time per asset class), and outcome (value of assets, value versus investment).
- Management—the bread and butter of legacy DAMs. Storage, organization, sharing, and management of assets. Data to capture here: number of users, search terms, and approval workflows.
- Performance—the missing piece of the cycle and most difficult to track. Once assets are published to channels like social, websites, and print, most DAM managers lose all ability to track those assets in the DAM. In a virtuous DAM data cycle, all asset performance data would remain in the DAM, even after the asset is shared—meaning you can more easily share performance data from all channels for a closed feedback loop.
This cycle may seem out of reach for some, but many innovative DAMs are already creating features that include this type of cyclical approach to data. In the meantime, viewing your DAM data through the lens of a virtuous cycle will help you find unexpected insights and suggest helpful improvements.
Data is a foundational element of DAM success. Learn how to set up your DAM to deliver key insights in our webinar DAM Data 101.
An non-exhaustive list of data you should be tracking
Common (siloed) metrics
Users
- Uploads, downloads, and searches by brand, project, or campaign
- Number of users
- Assets created and updated
- Session length
Search
- Number of searches broken down by brand, project, or campaign
- Success metric on searches – e.g. did someone download after a search?
- Search where there are no returns
- Keyword report under search
- Google keyword searches vs. DAM metadata
Geography
- Activity by city and region
- Uploads and downloads by country
Views and Downloads
- Least and most downloaded assets, by brand and by type
- Asset views within the DAM
Common metrics through the lens of a virtuous data cycle
Now imagine you’re collecting data from the management and performance stages of the cycle—perhaps your data shows that Agency A works more quickly through your workflows (management), while also creating assets that perform better on social (performance). Now, you can use that data to help enrich and optimize the creation stage. Once you begin looking at your data holistically rather than by individual metrics, you’re more likely to get truly valuable insights that inform workflow and creative improvements. You’re more likely to see the entire story of your DAM data.
Users are the key to every stage of the asset journey
Tracking users sets a baseline for how your DAM is being used. This data may surface questions like—how long are my users staying on my DAM? Are there a large number of users only logging in for two minutes each session? If so, why is that? Is it because the DAM experience is difficult to navigate or extremely streamlined? These insights will reveal how you can assist in the creation and management stages of the asset cycle with DAM training or workflow improvements.
Search data increases findability and closes content gaps
By tracking search terms that result in the incorrect asset results, you’re able to reveal two things. First, whether your data model and tags reflect the closest synonyms and popular misspellings of words to increase findability. And second, how exploring unsuccessful search terms can reveal a content gap in your assets and help you support your creative teams in filling that gap. Your users are telling you what content they need and how they search for it—this will help inform feedback for the creation and management stages of the asset cycle.
Geography reveals more about the performance of assets than you think
Typically, geography reporting only tells you where a user is accessing assets. But if you break out of that silo, you may notice other interesting insights arise. For example, when comparing geography to search results data, you may encounter a need for more localized assets, or a need to localize an asset because it’s often searched for, but never downloaded.
There are also insights to glean when comparing data from the creation stage of the asset cycle to an asset’s geography. Does content take longer to get approved in different regions? Is there a legal, rights, or communication blockage in the workflow? In this way, data from one stage of the cycle (management) can inform and improve another stage of the cycle (creation).
Similarly, channel performance data sorted by geographical tags can be revealing. What images resonate more in Europe vs. North America? That data can inform how you create new assets, manage which retail partners have access, and which distribution channels you focus your advertising budget on. When you break out of individual data silos, possibilities swirl.
Views and downloads show you where the data cycle ends (or should continue)
For many DAM users, after downloading an asset, their session within the DAM stops right there. Unfortunately, downloading is where the virtuous DAM data cycle cuts off too. So, when your data reveals that downloads outweigh any other method of sharing assets, it may be a risk indicator.
This data may surface questions like: does this user know about the DAM’s sharing functionalities and how they work? Is this an opportunity for training or internal communications?
If most users are downloading instead of sharing directly from the DAM, you’re losing out on the ability to recall assets, update them, and redistribute them from a central, secure source.
Create a cycle of virtue, not a circle of chaos
You can only tell part of your data story if you have three silos of disconnected data. In a perfect world, all assets would be available to be tracked, updated, and distributed in one holistic, data asset management system.
In the meantime, breaking out of a siloed view of data is your best chance at discovering insights that represent the full story of your assets and your DAM. It requires you to track individual metrics while analyzing how they interact with processes and users at every stage of the asset journey—from creation to management to performance. And to use those insights to suggest improvements that would make each stage better. It’s no simple task, but this process promises fewer vicious tornados and more virtuous cycles.