
It’s a year of recession and uncertainty, but there is one thing we do know for certain: the demand for high-quality digital brand content is still growing.
So how does a company meet that need with (likely) fewer resources than they’ve had in the past, and more scrutiny on how those limited resources are spent?
Tools like digital asset management (DAM) platforms are the answer. We know that DAMs can be a productivity multiplier for creative and marketing teams, allowing them to create, publish and share content faster than using old tools like Google Drive. And yet, it’s sometimes hard to know for sure.
To that end, together with John Horodyski of Salt Flats, we’ve put together three must-have DAM productivity reports you can pull today that will help you understand how the system is being used, find opportunities to be more efficient, and demonstrate ROI to your leaders who may otherwise question that big tech spend.
Report #1: User Adoption
So you might be thinking: wait a minute, what does user adoption have to do with productivity? The answer is, everything.
If users aren’t in your system, using the tools you provide or the processes you’ve created, then you’ve got an immediate productivity issue. Users that are not operating within established processes are going to impact the users who are, slowing them down with questions, or forcing them to search for content and assets outside of the DAM.
It’s also an indication there may be a problem with your tools or processes themselves. If users aren’t adopting these things, there’s probably a good reason. This is a way for you to identify a potential productivity problem and fix it right away.
Here’s what you want to look at and build into your report:
- % of total active users across groups
- # of uploads / downloads / requests
- Asset ingestion metrics
- Standard web analytics (unique visits, pages, views, etc.)
- Number and types of searches
- Login frequency
Learn more about the three productivity reports you must have, and how to pull them!
Report #2: DAM Efficiency
This is the report you expected to see on this list. How much is your DAM improving efficiency and speed across the asset lifecycle? Is it making your creative teams faster? Is it getting assets into circulation faster? Does it allow users to get more done?
By looking at this report, you’ll be able to see if your tools and processes are paying off, or if there are opportunities to tweak or change what you’re doing to go even faster. Rather than focus on users like in the first report, this one is all about the system and process.
In this report, you want to:
- Quantify / qualify the reduction in workflow times (ingestion / identification / use & reuse)
- Quantify / qualify the reduction in support tickets
- Measure product launch timelines
Report #3: Savings & ROI
It’s notoriously difficult to accurately measure the ROI of a DAM platform, but that doesn’t mean you shouldn’t try. Some of the metrics in this report may not be easily available to you depending on your DAM, but it gives you an idea of where this type of report should go.
When you think about ROI in DAM, you need to look at a wide range of areas. From labor cost savings due to efficiency improvements, to risk reduction due to stronger controls on content usage, it all comes together to create value for the business. In this report, we’re focusing primarily on ROI due to productivity gains, but if you’re up to the task, you can go even deeper.
Here’s a look at metrics to include in your productivity ROI report:
- Labor cost savings
- Savings in agency spend
- Asset reuse percentages
- Total cost of ownership metrics
- Cost savings due to self-service improvements
The Role of Technology in Reporting
This is going to sound straightforward, but the key to good DAM productivity reports is having a system that enables you to gain the insights you need.
Is your DAM good at reporting?
Not all DAMs are created equal. Some are limited to reporting very basic numbers, like how many users are in a system or the number of assets you’ve stored there. To really get to the heart of productivity, you need access to advanced reporting in two areas: asset lifecycle and metadata.
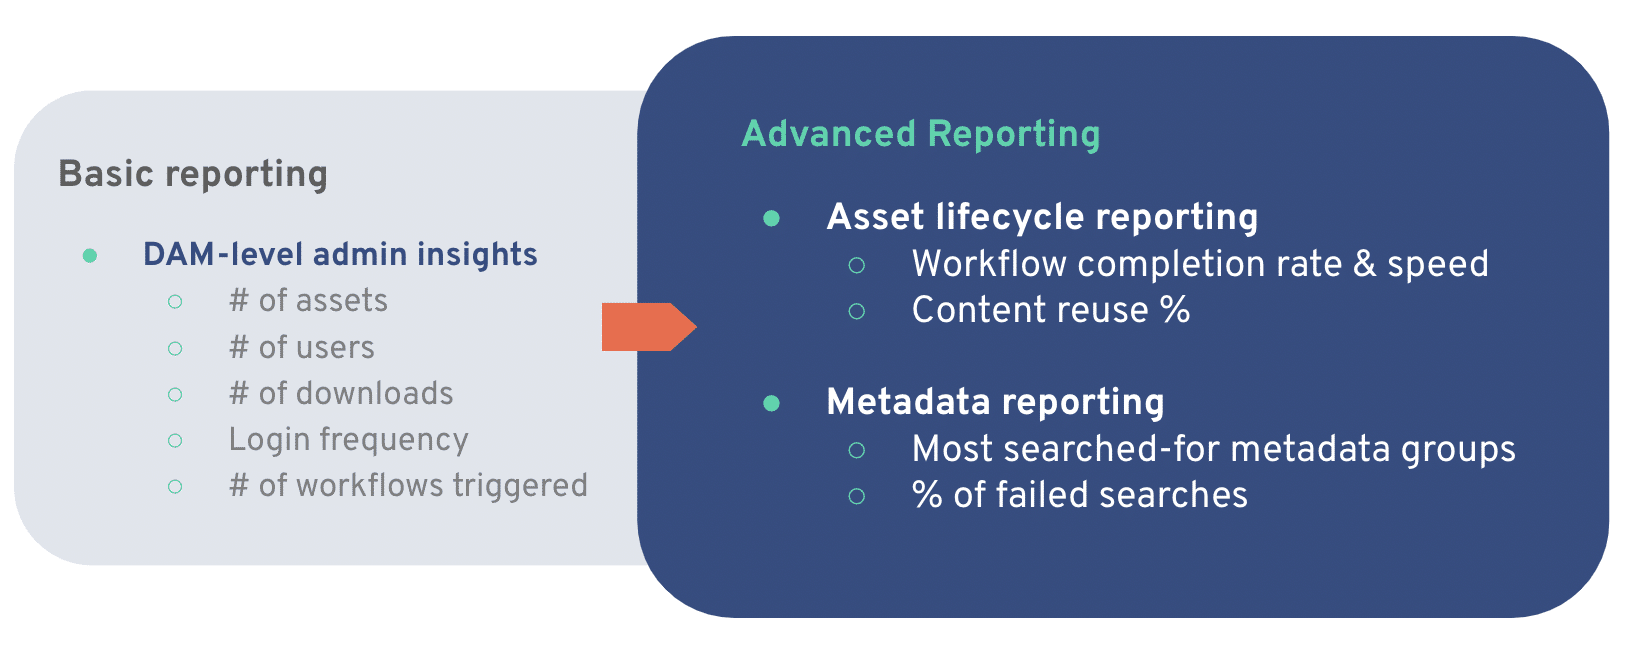
Asset lifecycle reporting lets you measure things like workflow completion rates and speed, and content reuse percentage. Your DAM needs to be able to tell you how an asset is moving through the system, how long it takes, and whether or not your content is being used (or reused) in a productive way.
Metadata reporting, on the other hand, lets you know how users are finding assets in the system. These types of metrics let you measure how long it takes a user to find content, how many failed searches they have before they find what they’re looking for, and if there are ways to better optimize your metadata to improve findability of assets.
Is your DAM configurable?
Every brand has a slightly different use case or process they want to measure in the DAM. This makes it really hard for any one DAM to provide all the insights you want straight out of the box. You need a platform that you can configure to tell you the things you want to know.
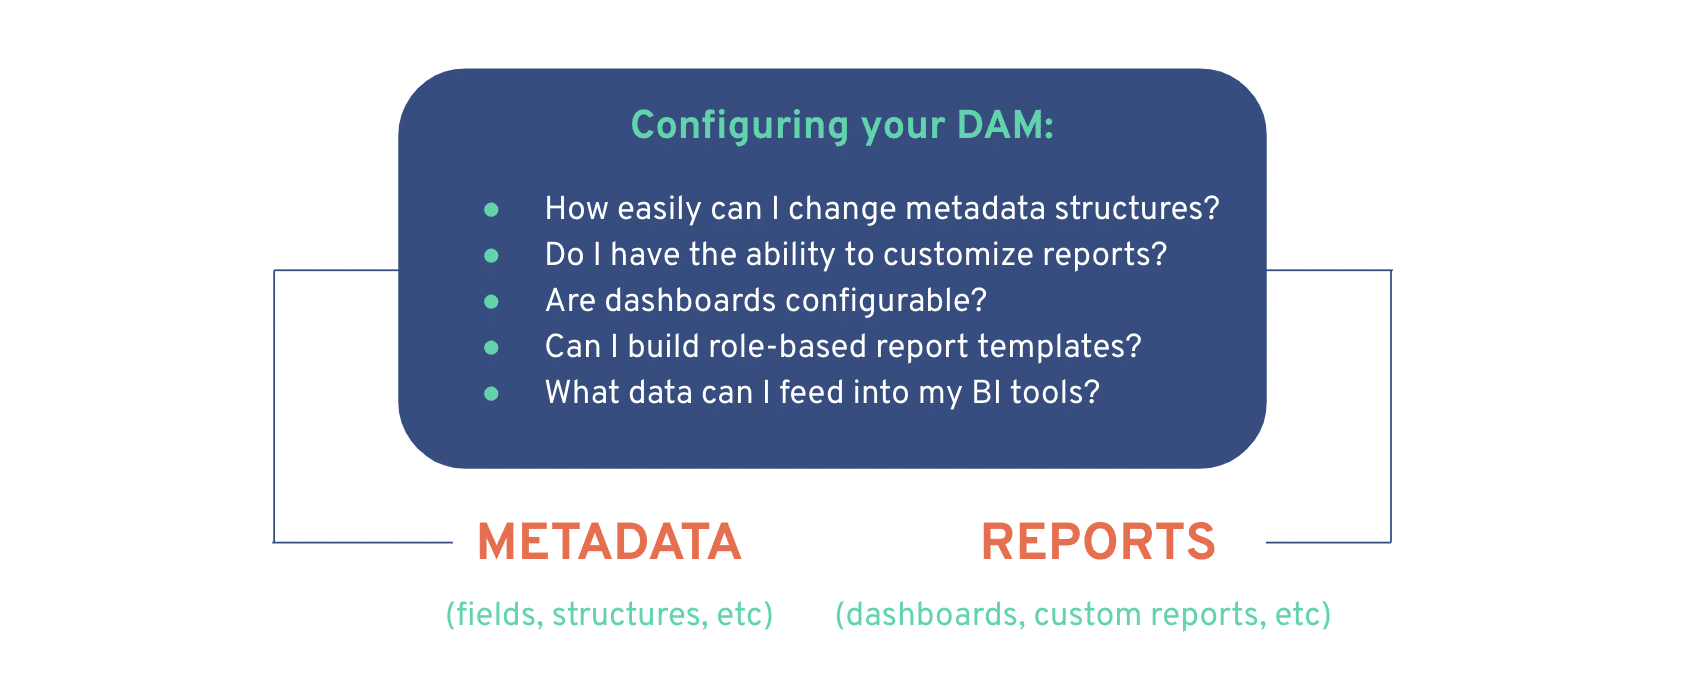
Ask yourself these two questions. First, can you easily configure the system to give you the reports you’re looking for, either through customized dashboards or things like role-based reports. Second, can you configure the metadata across your system easily so you have access to the insights you need at the asset-level.
If the answer is no, you won’t be able to get the full value you’re looking for.
Where is your data coming from?
Take a look at your tech stack and ask yourself: where is my data coming from?
This is a little more advanced than some of the other ideas in this blog, but the concept is straightforward when you think about it. There are many tools you have that impact an asset’s lifecycle, and that your DAM interacts with to get content from creation to publication and distribution. What you want to know is, how is your DAM pulling information from those systems to give you a more complete picture of that entire asset lifecycle?
If your DAM can’t receive or pass data along the tech stack, it’s limiting your ability to truly understand how the DAM is improving (or hurting) productivity for your users. This hinders you in terms of measuring ROI of the DAM, and of optimizing efficiencies to meet your aggressive content targets.
Get started on your DAM productivity reports
Getting started is easy. By using the above direction, you can start pulling together reports today that will serve you year-round and beyond. Your leaders will appreciate the insight into how the DAM is bringing value to the business – which helps justify the spend – and your stakeholders will value the direction you can give them on where to find opportunities to improve their productivity across the asset lifecycle.
To learn more about getting started, watch our webinar with John Horodyski of Salt Flats where he tackles this exact topic.
Related Resources
Optimize Your Media Supply Chain: The Blueprint for Composable Architecture (and the Role of DAM)
Retail Challenges and Digital Transformation: 2024 & Beyond
Why DAM Implementations Fail and How to Plan for a Successful DAM Project
Generative AI & Copyright: What Creatives Need to Know

Speak DAM to Me: 3 Strategies to Drive User Adoption in Your DAM